


• Gold price dropped below $4,000 psychological level with Monday’s 3% plunge followed by Tuesday’s continued weakness.
• The move was triggered by US-China trade framework agreement at ASEAN conference eliminating 100% tariff threat.
• Near-term gold price predictions suggest the metal could decline by another 17 percent, although the long-term outlook remains bullish.

The price of gold in Sri Lanka has dropped below the Rs. 300,000 mark compared to recent weeks, it was reported.
According to local gold merchants, the price of a 22-carat gold sovereign is now listed at Rs. 298,000.
This reflects a decrease of Rs. 81,000 compared to Friday, October 17, when the price of a 22-carat gold sovereign stood at Rs. 379,200.
Meanwhile, the price of a 24-carat gold sovereign, which was Rs. 410,000 on Friday, has now fallen to Rs. 322,000.
Why is gold price falling today? Let’s check the current chart and gold price predictions
Gold price plunged below the psychologically critical $4,000 level on Monday, losing over 3% after its steepest single-day decline since 2020, as investors reduced safe-haven positions following breakthrough progress in US-China trade negotiations.
The precious metal continues its retreat today (Tuesday), 28 October 2025,, down another 1% to $3,963.53 per ounce, marking a three-week low and the first sustained move below $4,000 since the October rally stalled.
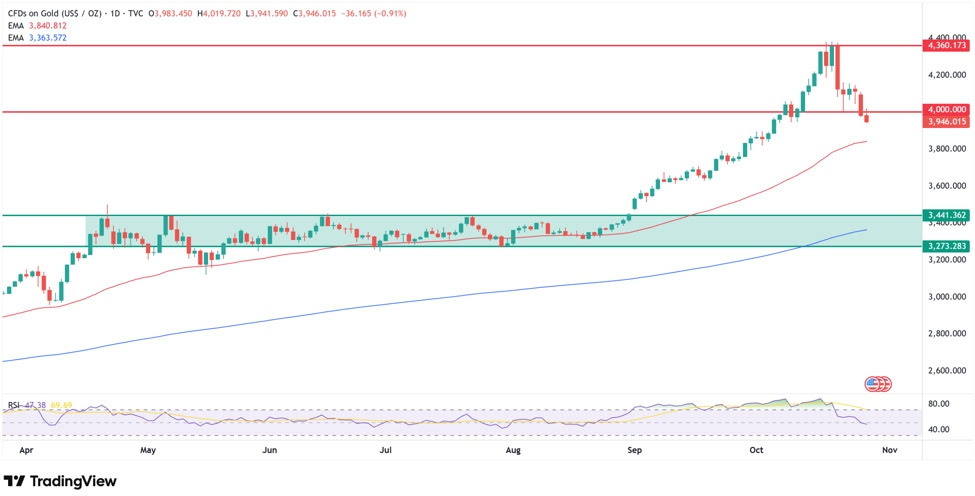
In this article, I explore why the price of gold is going down, conduct a technical analysis of the XAU/USDT chart, and identify a key support zone, suggesting that gold may correct by another 17%.
Why Gold Price Is Going Down Today?
The selloff accelerated over the weekend as US and Chinese negotiators meeting during the ASEAN conference in Malaysia hammered out a framework agreement that eliminates the threat of 100% US tariffs on Chinese goods and secures a one-year delay on rare earth export restrictions.
Treasury Secretary Scott Bessent stated the proposed tariffs are “off the table,” dramatically reducing the geopolitical risk premium that had propelled gold to record highs above $4,380 just days earlier.
| Gold Price Decline Metrics | Data (Oct 28, 2025) |
| Current Spot Price | $3,963.53/oz |
| Daily Change | -$18.00 (-0.45%) |
| Monday’s Plunge | -3.0% |
| Year-High (Oct 17-19) | $4,381.58/oz |
| Decline from Peak | -9.5% |
| Year-to-Date Gain | +42.83% |
| Support Target | $3,830 (50 EMA) |
“Gold is losing due to decreasing risk regarding international trade, while simultaneously reacting to recent moves from ETF funds,” Michał Stajniak, Deputy Chief Analyst at XTB, explained the catalyst for gold’s decline. “During the ASEAN conference in Malaysia, a meeting between Chinese and American negotiators produced a working agreement that eliminates the risk of 100% tariffs on Chinese products and is meant to reduce rare earth export restrictions from China to the USA.”
How low can gold prices go?
According to technical analysis, first downside target sits at 50 EMA around $3,830 (3.4% further decline), with main support zone between $3,270-$3,440 (17% downside) representing April-August historical highs coinciding with 200-day EMA creating strong reaccumulation confluence, though Trading Economics maintains Q4 forecast $4,157 and 12-month target $4,361 suggesting correction not reversal.
Should I sell gold now?
No. Despite 9.5% decline from October 19 peak at $4,381, gold remains +42.83% year-to-date and +49.65% year-over-year, with my technical analysis identifying $3,270-$3,440 zone (200 EMA confluence) as buying opportunity at attractive prices rather than panic-selling zone since “everything above blue 200 EMA is still an uptrend,” while Fed rate cut Wednesday (98.3% probability) and potential RSI reset to oversold would support buy signals.